Histogram shows completely different than Lightroom
Hi, Mods. Please move this to the Discussion area if you don't think this is a bug, I wasn't sure.
I discovered FRV via a couple of photography forums where it was mentioned with enthusiasm. I am also enthusiastic and would like to use it in my workflow.
Like many, I use Lightroom and am frustrated by the length of time it takes to import, and am looking for a simplified solution to the culling proccess. When I discovered FRV I thought it is the perfect solution. A big bonus for me is also that it is sensibly priced, I can afford to buy it.
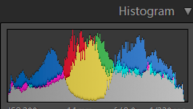
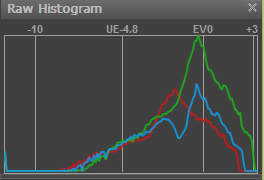
However, after installing and using it over the past couple of days, there is one element that stands out as an issue for me. The histogram is completely different to the histogram shown by Lightroom.
If the software is for culling, one of the culling criteria is going to be based on the histogram. If I can't believe the histogram, what use is the software?
Please Note: I would have searched the forum to see if other people report the same thing, but I don't see a search button?
My specs are: Fuji X-E2, Lr5.7, Win8.1x64.
As I can only upload two images per post (!), I'm going to add the others in a seperate post. Please Note: each pair of histogram images is of the same .raf file, one screenshot of FRV, the other of Lr5.7.
Cheers Smithy.
lexa
Wed, 09/13/2017 - 10:25
Permalink
Yes, histograms are different
Yes, histograms are different, because FRV and Lr histograms shows different data:
FRV: shows unprocessed raw data histogram (no white balance, no tone curve). Exposure adjustments just shifts numbers on X-axis because raw data not changed.
Lightroom displays processed image histogram with all adjustments made:
FRV histogram is intended for image culling: select best exposed image from sequence of (similar, but differently exposed) images.
Lr histogram shows processing/adjustment results.
--
Alex Tutubalin/FastRawViewer team
smithy
Wed, 11/29/2017 - 18:11
Permalink
Thanks Lexa, that helps me a
Thanks Lexa, that helps me a lot to better understand it.
So what am I looking for? I need to understand the dynamic range of my sensor and check the exposure is within the range?
"Exposure adjustments just shifts numbers on X-axis because raw data not changed." Okay, so what do I need to do, or look for, or understand?
Sorry if I come across as an idiot, but when I look at an Lr histogram, (or Ps, or other image viewers) I understand them but with FRV the histogram just confuses me.
Add new comment