How do you read the FRV histogram?
I should start off by saying, I really want FRV to work for me, but I'm not getting on with it:
I'm an enthusiast photographer, maybe your software is too complex for me, your RawDigger is certainly way over my head. Is FRV mainly created for trained professionals, or scientists?
I'm drawn to FRV because it allows me to sift through my .raf files and cull, without needing to spend all that time that Lightroom demands in its import process (which in turn allows me to shoot more freely because the culling process is much quicker & easier). I also love your additional features, really useful stuff. But I'm really struggling.
When I look at my Lightroom histogram, I understand it and know what I'm looking at and looking for. It's easy and familiar without needing to read a manual. When I look at FRV histogram, I get in a panic, it confuses me, I can't work with it because it doesn't make sense to me.
The histogram is where I get a sense for the image, but with FRV I just don't get it (it doesn't look like any other histogram I've ever seen).
Therefore, because your software displays a histogram that doesn't look anything like what to me is a familiar histogram, I, the user, am dependent on your explanation to understand what its about. And that doesn't tell me much either.
The only section in the User Manual that I can find that really talks about the histogram is the section, 'Working with Exposure' https://www.fastrawviewer.com/usermanual14/exposure.
But here I'm having trouble:
![]()
I don't understand what this means. What is the value of '1'? By 'the leftmost mark' do you mean the -10 line?
![]()
![]()
Just what do either of those mean?
![]()
By the 'underexposure level indicator' do you mean the -5 line?
![]()
This feature allows me to tailor FRV to the dynamic range of my sensor, I like it!
I just feel like your software (and the user manual) is written for scientists. Maybe it is and I'm in the wrong place :-)
On the other hand, if your software is indended for regular enthusiasts and pros alike, could I please get some guidance on how to read YOUR histogram, what am I looking for, maybe help in understanding why are the corresponding areas in histograms from FRV and other software are so different.
I do get that the Lr histogram is based on a jpg view, or something like that, and FRV is the accurate, real raw histogram, but that doesn't help me to understand it. I like what your software is about, I like it's really useful features, but I'm REALLY struggling to get past the first post.
Any and all feedback greatly appreciated, Smithy.
LibRaw
Wed, 11/29/2017 - 20:15
Permalink
Dear Sir:
Dear Sir:
Let's try to approach things step by step.
> The leftmost mark of the scale is the level that corresponds to the value of “1” in the RAW data.
The leftmost mark is the left wall; it is where the value in raw is equal to 1.
> The histogram step on the horizontal axis is 0.1EV, so there will always be a “comb” in the shadows, as there are less possible levels than 10 levels per stop.
In raw, say it is 14-bit raw, there are maximum 16383 levels from shadows to highlights. The first stop in highlights contains half of those, up to 8191; next stop contains half of what is in the first stop, 4095; following stops contain respectively 2047, 1023, 511, ..., and finally, the last three stops contain 7, 3, 1 level respectively. This progression simply means that the exposure in each next stop is half of what it is in the previous, brighter, stop. If the step is 0.1 EV, to fill a stop one needs at least 10 levels; with only 7 levels you will see gaps, and histogram starts to look as a comb.
If something in the above is unclear, please say so and we will try to explain better.
smithy
Thu, 11/30/2017 - 13:57
Permalink
Hi, thanks so much. I'll just
Hi, thanks so much. I'll just take a bit of time to work through your answer and get back to you, Cheers.
PhotoMan
Tue, 04/25/2023 - 11:46
Permalink
I also dont understand a
I also dont understand a about your histogram perhaps there is some background information needed before one can understand it.
What is "16383 levels", levels of what what exactly could you refer to somewhere where it explains in layman terms, i am consumer and dont need to dive deeply in the inner working of how data stored in RAW file.
"from shadows to highlights" shadows and highlights are not the edges of traditional histogram its in the middle edges represented by blacks (left most wall value 1) & whites (right most wall value 255).
"first stop in highlights contains half of those, up to 8191" from what i understand so far from manual "EV0 – the level that corresponds to the middle gray" so first step in highlights would be from EV0 to +1 EV on your histogram?
By the way your histogram does not show +1 EV it goes from EV0 to +3 EV.
"Next stop contains half of what is in the first stop, 4095; following stops contain respectively 2047, 1023, 511" wait there are only +3EV on your histogram so did you actually mean -1EV, -2EV -3EV etc. until we reach the "left most wall" of your histogram?
"This progression simply means that the exposure in each next stop is half of what it is in the previous, brighter, stop." Each next stop is counting from EV0 down or +3EV down or from "right most wall" of your histogram?
"If the step is 0.1 EV, to fill a stop one needs at least 10 levels; with only 7 levels you will see gaps" wait step is 0.1EV where on histogram i so far dont see even 1EV steps its -10 -5 0 and +3, where 0.1EV come from?
Could you demonstrate screenshot of how overexposed image would look on your histogram, does it anything that reaches past +3EV mark or past "right most wall"?
Yeah just what exactly "right most wall" on your histogram represents?
lexa
Tue, 04/25/2023 - 13:28
Permalink
Dear Sir:
Dear Sir:
It seems that your question refers to RawDigger. To avoid confusing FastRawViewer users, please ask your questions regarding RawDigger on RawDigger forum https://www.rawdigger.com/forum , or via e-mail support@rawdigger.com
--
Alex Tutubalin/FastRawViewer team
PhotoMan
Thu, 04/27/2023 - 14:26
Permalink
It seems that your question
No, my question is about FRV histogram and answer you given in this thread above, could you please answer this specific questions to help me understand your hystogram?
PhotoMan
Tue, 04/25/2023 - 12:22
Permalink
By the way i watched the
By the way i watched the video about RawDigger histogram, guess it has similar histogram, and still i have zero clue what it all means. Is there name for this particular histogram so i can google more info about it?
Is there possibility you include RGB histogram for simple folks who dont need to dig in, sort of same histogram as shown when you switch to embedded JPEG ("J" key) and it seems close enough to RGB diagram that shows in Photoshop.
lexa
Tue, 04/25/2023 - 13:31
Permalink
The RGB-histogram is not a
The RGB-histogram is not a RAW-data histogram, but a histogram of rendering results (so: different in different programs and changing with rendering parameters change). Thus, the RGB histogram will not help the culling of frames, but only confuse.
--
Alex Tutubalin/FastRawViewer team
PhotoMan
Thu, 04/27/2023 - 02:06
Permalink
At least RGB histogram can be
At least RGB histogram can be easily understood because many people are already familiar with it.
Could you explain in how to read your histogram? Ideally in lyman terms or like you would explain to a eldely person who has no tech background. )
In my view you give very little details on how to understand histogram in FRV & RawDigger perhaps you assume other people who use this software have same background as you and would easily understand it, which is not the case with me and perhaps many others.
I am open to learning provided it will not take me too far away from joy of photography and into depths of inner working of RAW encoding that i don't need.
lexa
Thu, 04/27/2023 - 02:19
Permalink
FastRawViewer histogram's X
FastRawViewer histogram's X-axis is linear in photographic stops and created on non-adjusted/non-processed raw values (no white balance, no exposure/contrast adjustments). Middle-gray, highlights and underexposure areas are marked via vertical bars.
I don't see what else could be added to this, but I'll be happy to answer specific questions.
--
Alex Tutubalin/FastRawViewer team
smithy
Tue, 05/09/2023 - 21:27
Permalink
Well I've worked through the
Well I've worked through the FRV info, watched the RawDigger YT video, and I'm none the wiser.
Have to say you seem to need to be a scientist or photo-technician to understand the histogram. No offense please @lexa and @LibRaw, but you aren't making any sense.
I'm a photo enthusiast with years of passionate experience, but FRV offers me no joy or satisfaction, so I regret buying it.
Unless you can work on an explanation on how to understand/read the histogram, in non-scientific terms, the software is as good as useless to me.
I'm happy to accept I missunderstood the purpose of the software and it is too specialised for my needs. I wanted a fast raw viewer, but didn't anticipate it to be a scientific instrument of sorts. And you need to be a scientist or photo-technician to be able to use it.
Unfortunately without being able to understand the histogram your product has only limited appeal.
Thanks to @PhotoMan for chipping in!
Best wishes, Smithy
PhotoMan
Wed, 05/10/2023 - 04:18
Permalink
For me i learned that overexposure is shown when the lines hit the right most edge of histogram and (similar to regular histogram) and its enough for me, rest not really concerns me at this point.
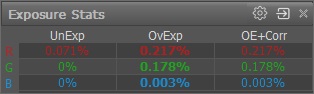
Also i find myself using Exposure Stats window more than i use histogram, because it actually shows how much percentage of overexposure is in each RGB channel. "OE+Corr" just means after you applied the exposure adjustment inside FRV, it can be pretty much be ignored also.
PhotoMan
Wed, 05/10/2023 - 04:45
Permalink
Forgot to mention inside FRV
This are exposure stats i mentioned in previous post
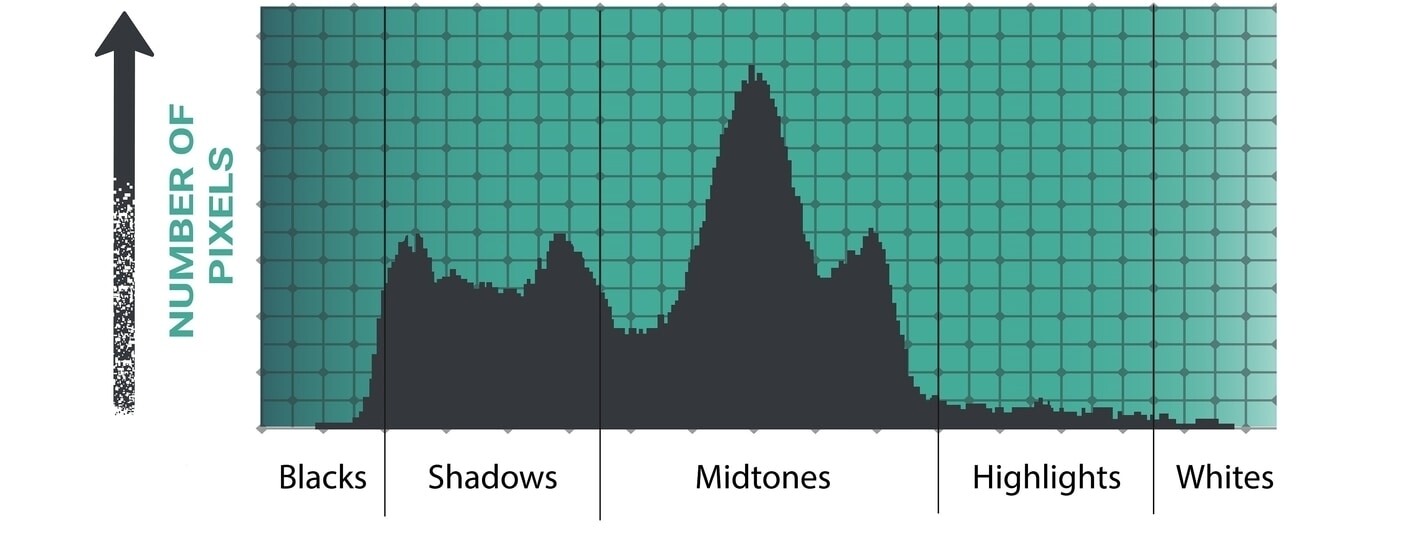
Inside FRV histogram has 15 stops total, -12EV is left most border of histogram, +3EV is right most stop of histogram.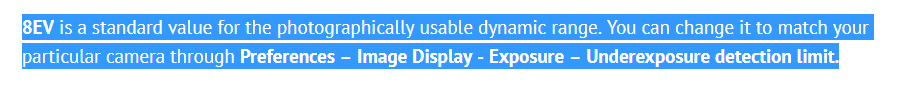
This setting
is for Exposure Stats meaning after how many EV stops down from over exposed mark (+3EV) program will report under exposed pixels (on histogam in my previous post that spot marked with "UE -10").
Theoretically this gives idea that my camera has total 13 stops of usable dynamic range everything lower is just clipped shadows, however its only for photos taken on ISO 100, on higher ISO values clipping occurs much faster i think at ISO 3200 all you get is about one EV stop of dynamic range, i would not trust it too much for shots with high ISO (Of course author made adjustment for this as well in options "ISO-Based underexposure limit", but i have not played with this yet)
smithy
Wed, 05/10/2023 - 19:46
Permalink
Wonderful @PhotoMan, that's
Wonderful @PhotoMan, that's really helpful and now finally the histogram is starting to make sense. Thanks for explaining in non-scientific English :)
Mt_Top (not verified)
Wed, 06/07/2023 - 23:10
Permalink
Very much enjoyed this
Very much enjoyed this discussion of Histograms.

If I understand this issue at all, this photo has very Underexposed areas (walls) and Overexposed area (window).
The Exposure Stats numbers under UnExp is telling us that about a third of the photo is Underexposed and OvExp says less than one percent is Overexposed.
I believe the blue spikes are the Comb referred to earlier in this message.
lexa
Thu, 06/08/2023 - 01:52
Permalink
Yes: there are no many
Yes: there are no many different values in deep shadow areas. The histogram reflects it.
--
Alex Tutubalin/FastRawViewer team